This article is published by China Science Software Network. If you have any questions, please contact us.
This case was provided by Ken Cobleigh, Dan Compton, and Wiebe.
GEOSS related background
On February 16, 2005, 61 countries reached an agreement: within 10 years, humanity will revolutionize the understanding of the Earth and its operating principles. The Earth Survey Organization held its third Earth Survey Summit in Brussels, which decided to implement the 10-year GEOSS program. Nearly 40 international organizations also participated in the program. After the 2004 Indian Ocean tsunami, the number of countries participating in the program almost doubled. In the coming months, more and more countries are participating in this historic mission. GEOSS brings huge benefits to each country and realizes the harmonious development between man and nature. These benefits are divided into nine categories (as shown in Figure 1.1).
These data come from satellites, aircraft, hot air balloons, ship radars, water stations, surface weather stations, buoys, and area data collected with recorders and data recorded with pencils and paper. The system can be divided into the following three groups: survey system and regional data, GEOSS information system and user community (as shown in Figure 1.2 and Figure 1.3). The use of these systems is as important as biodiversity, so we can measure, capture, analyze, and better predict disasters such as tsunamis, earthquakes, and volcanic eruptions. This can provide an Earth warning system that will save countless lives.
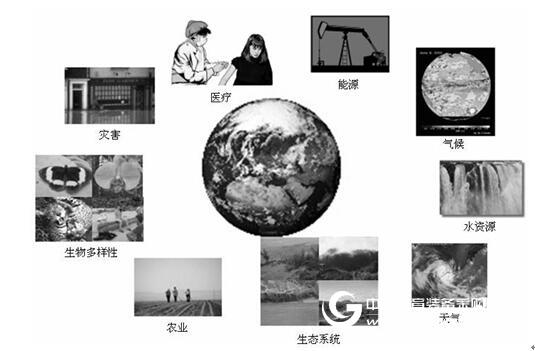
Figure 1.1 Social welfare obtained from Earth observation
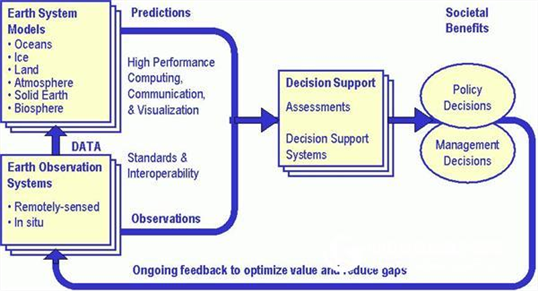
Figure 1.2 GEOSS dynamic decision process
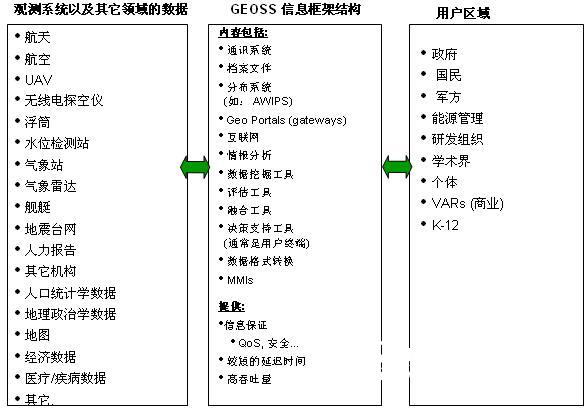
Figure 1.3 GEOSS end-to-end architecture
At present, in order to make long-term, high-level GEOSS become a reality, several difficult problems need to be solved. The researchers made an assessment of the GEOSS community, which includes several sub-communities. The author of this book consulted on the sub-community of the system. The main issues are as follows:
The ability to support and interact with multiple data.
Set a new standard format for raw data and processed data.
Provide information assurance to ensure that the data received is not compromised.
Provide data, information security, and control over access rights (national restrictions, confidential data, etc.).
Ensure the ease of use of data and information, including training, data mining, and other tools that are available.
Allow the use of the creation and use of decision making and support tools.
Allows technology and assessment results to work together (through a combination of multi-sensor and non-sensor for high-level results processing).
Provides high output from point to point.
Support for non-electronic conversion of data and information.
Provide a shorter reaction period.
As we have seen, these difficult issues will be resolved politically and economically. For example, is the economic interest determined by a country's gross national product or wealth, or by the country that most needs it? Obviously, there will be many discussions and negotiations before the system is completed. The most likely scenario is that the system will be completed in stages.
One problem that currently exists is that many systems are built as isolated systems. The data of these systems cannot be easily registered, interconnected, or fused with data from other systems (although this is not true in many cases, as is the case in some marine surveys and atmospheric controls (NOAA)) . Another key issue is that many countries do not like to share data with other countries (although sharing data can bring many advantages). They may think that national security or exclusive economic zones (200 nautical miles from the shoreline of a country) are threatened. These issues must be resolved before running the system. Once these problems are resolved, the system will exert tremendous power.
System dynamics background
In order to apply strategic analysis in the GEOSS system, we need to use Monte Carlo simulation, real option analysis, and system dynamics models. So in order to understand it quickly, you should briefly explain the system dynamics.
Although systems engineering can identify and materialize requirements and build systems, system dynamics allow us to observe the behavior of the system in a given environment. One of the models that can accomplish this task is the Ventana Vensim model, which allows us to conceptualize, classify, simulate, analyze, and optimize the powertrain. The system dynamics model can be built on a temporary loop, stock or flow graph. When the phrase is linked to the arrow, we build the connection in the system variable and record it as a temporary relationship. This information needs to be characterized by mathematical equations to complete the simulation model. We can analyze the model by establishing the process, examining the cause and use of the variables, and the loops involving the variables. When we build a model that can be simulated, system dynamics give us a deep insight into the behavior of the system.
A simple example is shown in Figure 1.4, which shows the behavior of the rabbit and fox community, and the relationship between the two communities in the dynamic system. There is a "fence" between the birth rate of the two communities, the initial population, the average lifespan of the rabbit and the fox, the fox's demand for food, and the ability of the rabbit to carry. Since these fences can be adjusted, the remaining variables can change the number of births (population, rabbit and fox deaths, rabbit herd, fox-rabbit hunting, and fox availability to food). Variables can be expressed in a list of queries. In this way, we can examine the behavior of rabbits and fox communities and their interrelationships.
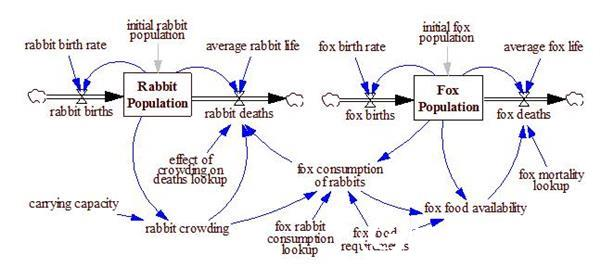
Figure 1.4 Fox-rabbit population system dynamic model (sample)
Of course, the good and bad of a model depends on its builder and basic assumptions. However, system dynamics has built-in tools, which can be the modeler's assessment of whether the model is reasonable and the unit is correct.
Create a GEOSS system dynamics model
In addition, the concept of system dynamics can be applied when creating the GEOSS model, and this is based on the US military's weapon conversion model Central Operations Network (NCO) (Figure 1.5). When submitting this to a GEOSS expert, we can note that the NCO principles can be modified slightly to suit the GEOSS model (Figure 1.6).
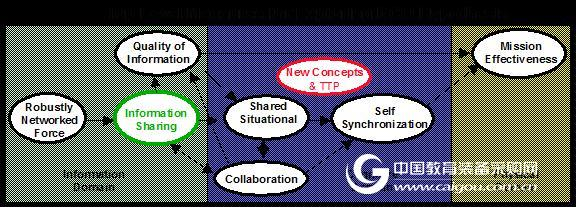
Figure 1.5 NCO model
74 technical areas need to be used for system systems (SoS) for operations. Optimization techniques used to judge optimal influence when judging system efficiency require a high degree of collaboration. In addition, we can connect it to real option analysis to assess the relative value of each technology area.
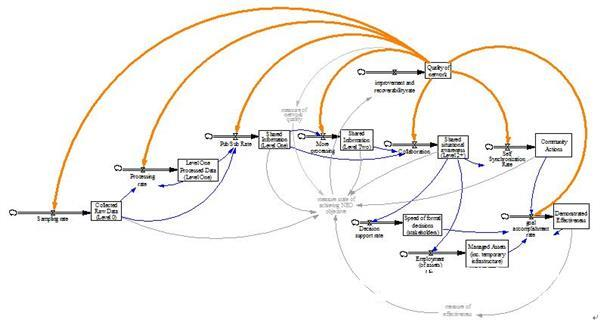
Figure 1.6 Dynamic Model of the GEOSS System
Real option value integration and cost-benefit results
In the complete GEOSS system, social and economic benefits are very important. For example: According to the US Environmental Protection Association (EPA), a brief list of potential benefits is as follows:
We can know exactly the harshness of the next winter, which can be used for emergency management, transportation, energy, and medical personnel, farmers, families, producers, and store owners. Weather and climate sensitive industries account for one-third of the US gross national product (GDP) ($3 trillion).
We can reduce the forecast error for the weather to within 1 degree Fahrenheit, which can save one million dollars in electricity costs per year.
Coastal storms cause 71% ($7 million) in disaster losses per year in the United States, and improved forecasts can have a positive impact on the United States.
In the United States, traffic delays due to weather can cost $4 million, and if you have an improved weather forecasting system, you can avoid two-thirds of the delay ($1.7 million).
More efficient real-time monitoring of air quality allows us to get accurate forecasts a few days in advance, so we can reduce the impact of bad air quality through proper traffic and energy use.
Using improved satellite ground surveys, we can revolutionize predictions of the world and regional climates so that we can predict droughts several years in advance.
Through real-time monitoring and prediction of water quality, we can feedback and predict the amount of pesticides and fertilizers used in real time to maximize agricultural production, minimize costs, build benign ecosystems, increase fishery production, and generate tourism revenue from the coast.
Globally, between 300 (million) and 500 (million) people are infected with malaria every year, and about 1 million people die from this preventable disease. Using an internationally interconnected system, we can identify the next most likely locations for SARS, avian flu, West Nile virus and malaria.
Earthquakes, volcanoes, landslides, floods, forest fires, extreme weather, coastal disasters, sea ice floes, space weather and major pollution incidents will cause serious damage to society. In the United States, annual disasters will bring millions of economic losses. These disasters are an important cause of life and property damage. GEOSS's forecasting, monitoring, and predictive capabilities for natural and technological disasters are key to mitigating the impact of disasters.
Thousands of technologies are currently surveying the Earth. These technologies demonstrate their value in estimating crop yields, monitoring water and air quality, and improving flight safety. For example, according to the EPA, American farmers will receive $15 in revenue from each dollar forecast. The value of US farmers changing their planting decisions is estimated to be over $250 (million). The US yield of marine surveys for the El Niño phenomenon is 13% to 26%. At the same time, there are thousands of floating data collection stations and more than 50 environmental satellites in the world's oceans, which provide millions of data sets, but most of them are not compatible with each other. If they are not compatible, then the integrated GEOSS system will always have dead zones and uncertainties. If scientists can't monitor every drop of water, every air, every piece of land on earth, then they don't know what's going on on Earth. Therefore, the challenge we face is how to bring all the technologies together so that we can make decisions reasonably.
Path to strategic options
Since this project requires global collaboration, this case cannot explain the current strategic options and the numerical analysis involved in risk analysis. However, to illustrate some of the options that GEOSS has, here is an example of a strategy tree for building a real option framework. Of course, all paths to the entire policy tree are much more complicated than this simple strategy tree. For more specific details on generating a strategy tree, see the author's other work and use SLS software (see Real Options Analysis: Tools and Teehinques, 2nd Edition. (Wiley, 2005)) to model and qualify real options.
To demonstrate the basis of GEOSS options, Figure 1.7 shows three strategic paths for the Global Earth Observation System.
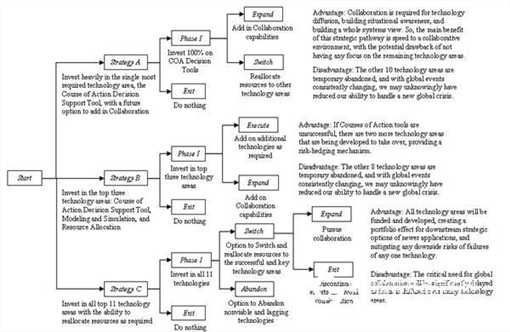
Figure 1.7 GEOSS Real Options Strategy (sample)
Strategy A is a large percentage of the investment in the Course of Action Decision Support tools. We judge that the development of Course of Action technology will be faster than the development of other technologies, because it has a huge influence on the collaborative operation. Collaborative operations are required in terms of technology communication, contextual awareness, and the creation of a global perspective. The main benefit of this strategic path is the ability to quickly achieve a collaborative environment, with the potential disadvantage of not focusing on other technologies.
Strategy B invests in the three most important technologies, the Course of Action Support tools, Modeling and Simulation Decision Support tools, and Resource Allocation tools. Combining these technologies can lead to the development of certain development options. Therefore, the Course of Action Support tools are not applicable, so there are two other technologies that can be adopted, thus completing the hedging mechanism for risk.
Strategy C is invested in the most important top 11 technologies, and the more important the technology, the greater the weight. The advantage of this strategy is that all technologies will be invested, which in effect creates a portfolio that reduces the risk that any technology will not function effectively. However, the disadvantage of this method is that since the allocation of resources is dispersed, the global collaborative operation will be significantly delayed.
Each strategy path has several branches, and each branch has an option to use a certain technology. This is a nested option (also known as an option option).
Of course, we are working harder and this will face enormous challenges. However, if we combine simulation, real option models, system dynamics, and optimization tools, our analytical methods and conclusions will be more convincing.
Sunshade Window Roller Curtain
Sunshade Window Roller Curtain,Sun Shade Roll Up Blinds,Sun Shade Roller Blinds Outdoor,Window Roller Curtain Sunshade
Hebei Charlotte Enterprise Co., Ltd. , https://www.hbcharlotteawning.com